System resources
System resources shows recent CPU, memory, and load activity for the selected STServer. Use it to check resource usage while recording, ingesting, or playing back missions.
Opening the charts
- Open Admin with an account that has administrative privileges.
- In the Server card under Overview, find the CPU, Memory, and Load rows. Each row shows the latest reading and a small chart of the last minute.
- Click any resource row to open the System resources dialog. All three resource charts appear together.
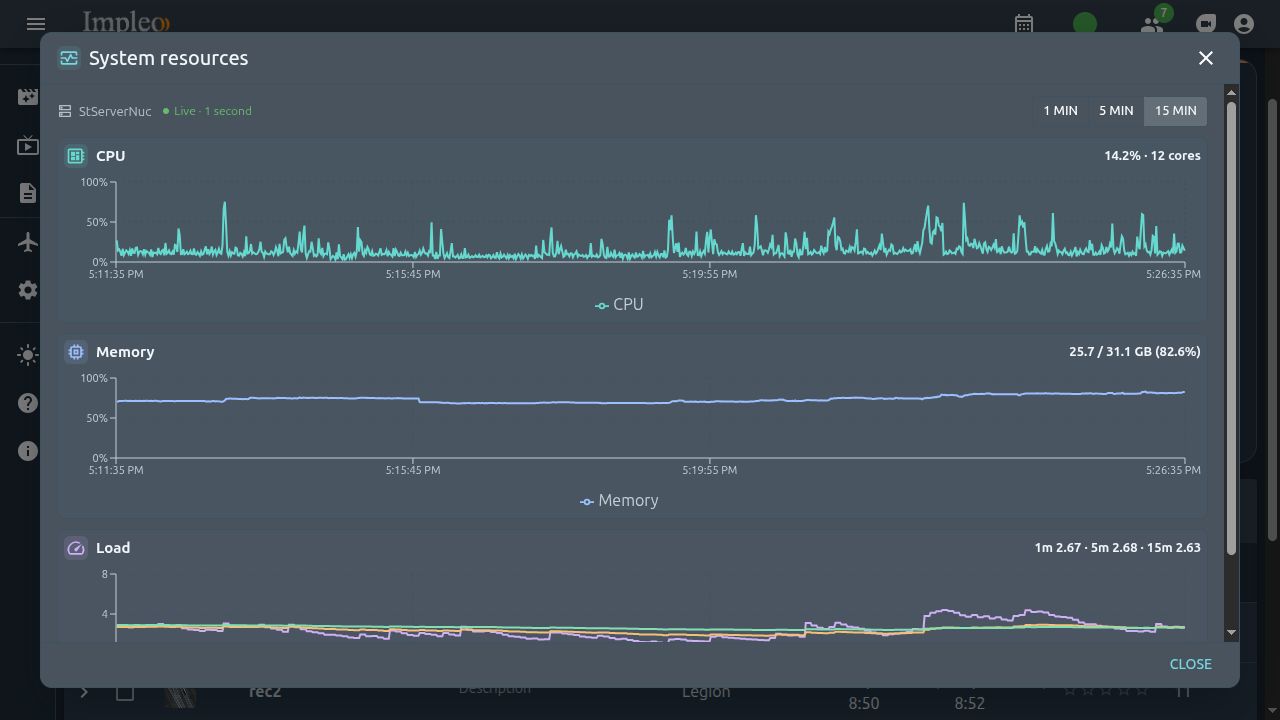
Example readings from a running server. Your values and history will differ.
Reading the resources
| Resource | What it shows |
|---|---|
| CPU | Overall CPU utilization, from 0 to 100%. The dialog also shows the number of CPU cores when available. |
| Memory | Used memory, total memory, and the percentage used. Used memory is calculated from total minus available memory. Values labeled GB use 1024-based units. |
| Load | The system load averages for the last 1, 5, and 15 minutes, drawn as separate lines. Load is a numeric value, not a percentage. Load averages are unavailable on Windows. |
The icons and colored accents identify the resources: CPU uses a processor icon, memory a memory-chip icon, and load a gauge icon. The compact chart panels adapt to the window height, and the dialog supports both light and dark themes.
Choosing a time range
Select 1 min, 5 min, or 15 min at the top of the dialog to change the visible history for every chart. The default is 15 min. This is the chart's time window; the load chart always keeps its three averaging periods.
Hover over a chart to see the timestamp and values for that point. The memory tooltip also shows used and total memory. Close the dialog using the X in the title bar or Close at the bottom.
Updates and availability
Resources are sampled about once per second. Live · 1 second indicates recent data. Polling pauses while the browser page is hidden and resumes when it becomes visible again.
- Collecting… appears while waiting for the first sample.
- Stale · updated … appears when the latest sample is at least five seconds old. The timestamp shows when that reading was collected.
- Resources unavailable appears if the request fails before any data has been received. Individual unsupported or missing readings show Unavailable or a dash.
- Gaps in the chart indicate missing samples; they are not zero readings.
The server keeps up to 15 minutes of recent history in memory. After a server restart, history starts again, so part of the selected time window may be empty.